The worst day in market history had no headline
On 19 October 1987 the Dow fell 22.6% in a single session. There was no war, no bankruptcy and no announcement. Almost forty years later there is still no agreement about what started it.
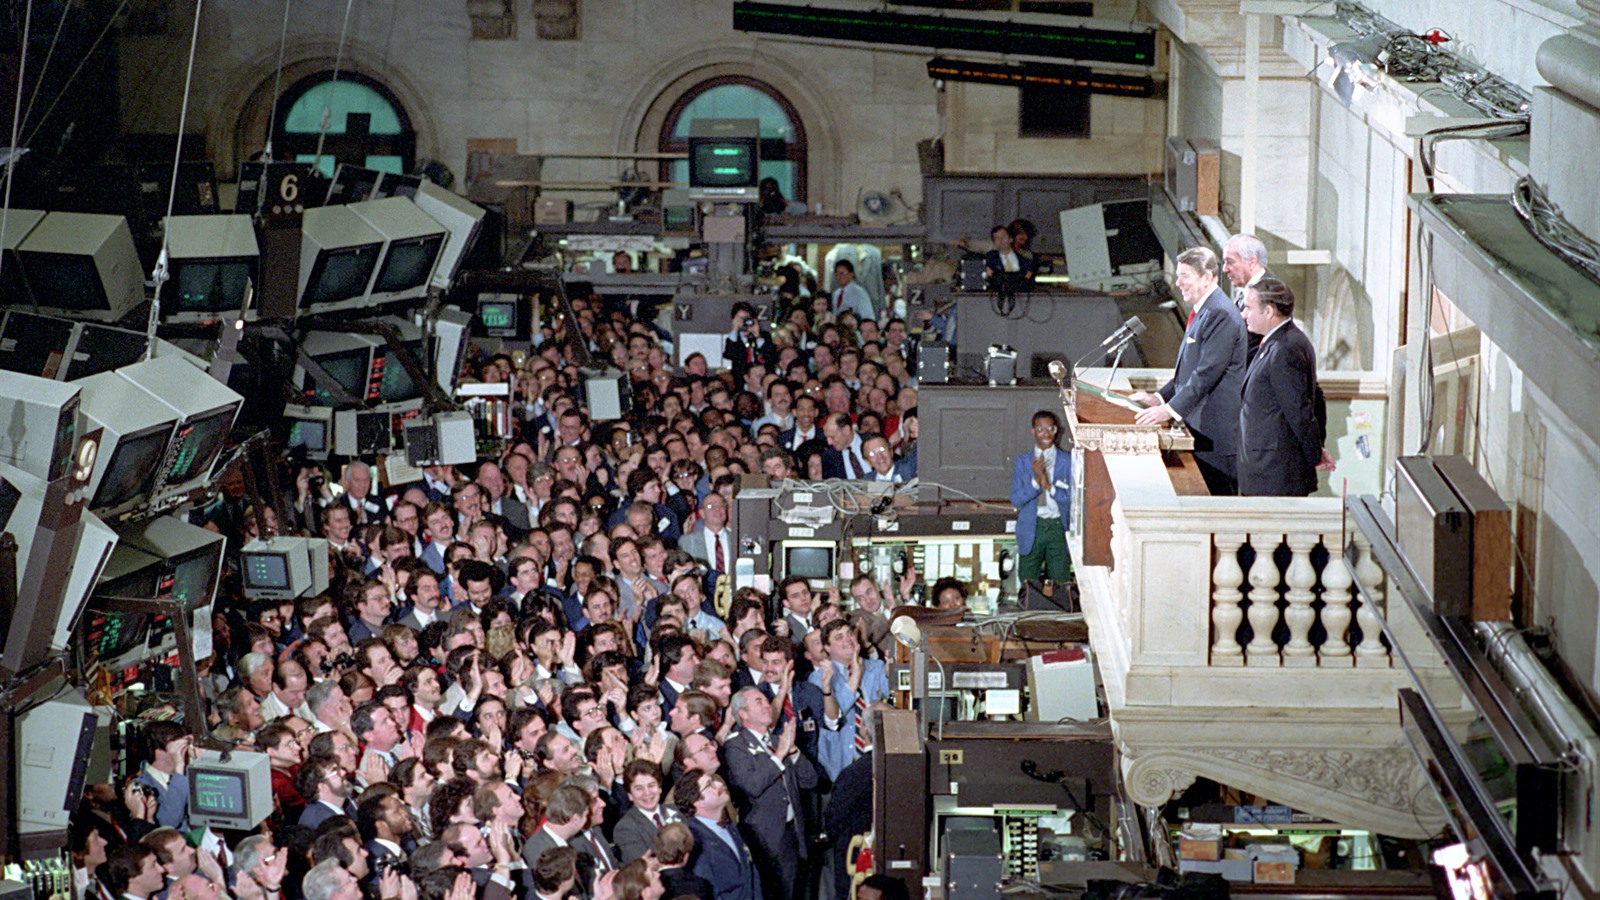
Every famous market collapse comes with a cause attached. In 2008 it was housing debt. In 2020 it was a pandemic. In 1929 it was the end of a decade of borrowed optimism. Black Monday has nothing. On Monday 19 October 1987 the Dow Jones Industrial Average fell 508.32 points, or 22.61%. That is still the largest one day drop in its history. If you go looking for the news that caused it, you will not find any. No country was invaded, no bank failed that morning, and no company confessed to anything. The market simply opened and fell for the whole day.
How big 22% actually is
Percentages flatten things, so it is worth translating. A 22.6% fall in one session is roughly the equivalent of every listed company in America losing more than a fifth of its value between breakfast and dinner. The New York Stock Exchange lost more than 500 billion dollars of market value, which was its largest loss since the outbreak of the First World War in 1914.
It also ended a long run of good years, because the bull market that died that Monday had been running since August 1982. A generation of investors had spent five years being rewarded for optimism, and they were repriced in about six and a half hours.
The Dow had peaked at 2,722 points in late August, so by the closing bell on the 19th it had given back an enormous amount of ground in under two months. Recovering that peak took until 1989, which is worth remembering whenever somebody describes 1987 as a crash that was over quickly.
The insurance that made it worse
The spark is still argued over, but there is broad agreement about what turned a bad day into a historic one, and it is not what most people expect. The thing that sped it up was a product built to protect people.
It was called portfolio insurance, and it had been developed by two finance professors, Hayne Leland and Mark Rubinstein. The idea was reasonable. A large investor who wanted protection from a fall could hedge automatically: if prices dropped, the strategy would sell stock index futures, offsetting some of the loss on the portfolio itself. Sold as insurance, it behaved like insurance, and by 1987 a great deal of institutional money was using it.
The flaw only appears when everybody has it at once. Because the rule is to sell when prices fall, a fall triggers selling, and that selling pushes prices down further, which triggers more selling from everybody else running the same rule. It is a machine that turns a decline into a steeper decline, and it does not need anybody to panic. It simply follows its instructions.
Walk one loop of it and the problem is obvious. Prices open lower, so the strategy sells futures to hedge. That selling is itself a signal to the rest of the market, and it pushes prices lower still, which means the hedge is now too small and the strategy has to sell again. Each step is the correct response to the step before it. The sequence has no natural stopping point, except a buyer willing to take everything on offer. On 19 October there were not enough of those buyers. The sellers were following a rule rather than a judgement, so nothing in the system could pause and think again.
The Brady Commission, the presidential task force set up afterwards under Nicholas Brady, put numbers on it. On 19 October, just three portfolio insurance strategies accounted for close to 2 billion dollars of selling, Ten other big investors behaving the same way added roughly another 1.5 billion. Nobody involved was being reckless. Each was following a strategy that made complete sense on its own.
Why the trigger is still argued about
It is more accurate to say the crash has no agreed beginning than to say it has no explanation. There are plenty of candidates. Shares had risen a long way and were expensive by most measures. Interest rates had been climbing. There was friction over trade and the dollar. Markets in Asia and Europe fell before New York opened, so some of the momentum arrived from abroad.
What none of those explain is the size. Every one of them was known on the Friday, and none of them was new on the Monday. That is the genuinely uncomfortable part of the story, and the reason it still gets studied: a market can fall further in one day than it ever has, before or since, without anything in particular happening.
What it left behind
The most useful legacy of that day is something you have almost certainly seen mentioned without knowing where it came from. The Brady Commission recommended a mechanism to interrupt a cascade like that, and the result was the circuit breaker.
A circuit breaker is an automatic rule that halts trading once an index falls by a set amount. Nobody decides it and no official signs it off. It exists to force a pause into the kind of self feeding loop that portfolio insurance created. The theory is simple enough: a market given twenty minutes to breathe behaves differently from one that keeps falling without a break.
They are not a historical curiosity. When Korea's market fell hard in July 2026, a circuit breaker halted trading for twenty minutes, which we covered in that week's recap. It was the eighth time one had fired in Korea that year. Every one of those halts is a direct descendant of a single Monday in 1987.

What it teaches
Three things, and none of them require you to predict anything.
The first is that markets do not owe you a reason. We are wired to look for a cause behind a large move, and the financial press is obliged to supply one by the evening. Sometimes there genuinely is not one, and being comfortable with that is more useful than accepting a tidy explanation that was invented to fill the silence.
The second is that safety measures can create the danger they were built for. Portfolio insurance worked perfectly for any individual holder and was dangerous for everybody together. That pattern repeats constantly, and it is worth spotting: a strategy that is sensible for one person can be dangerous when everyone adopts it, because their selling becomes your falling price.
The third needs stating carefully, because the encouraging version of it gets repeated without the rest. The Dow began 1987 at 1,897 points and finished it at 1,939, so the calendar year that contained the worst day in market history actually closed slightly higher than it opened. Nearly 60% of the losses came back within two trading sessions.
But the peak was 2,722 in August, and that level was not seen again until 1989. So the honest summary is not that the market shrugged it off, and it is not that a generation was wiped out either. It is that the index recovered its year quickly and its high slowly. Which of those two facts you hear depends on who is telling you the story.
The people genuinely ruined were the ones who had borrowed to invest, because they were not permitted to wait for either recovery. That is the argument in How to lose more than you put in, and 1987 is one of the clearest examples of it on record.
This article is educational and reflects the views of the Wealth Stratum community. It describes historical events and general market mechanics, and is not financial advice or a recommendation to buy or sell any security. Always do your own research.